What is it?
Phosphorus (P) is an essential nutrient element for plants and animals. Only a small amount of the total P in soil is in forms able to be taken up by plants (plant-available P). The Olsen method is a chemical extractant (bicarbonate) that provides a reasonable estimate of the amount of plant-available P by measuring phosphate from soil solution and exchange surfaces. Olsen P values are commonly used to calculate P fertiliser requirements.
How to interpret it
Soils differ in their P contents, and how readily the P is released. Allophanic (Yellow brown loams) and Pumice soils (Yellow brown pumice) have a high “P retention”, so that even when total P may be high, a comparatively smaller amount is available to plants. For these soils higher Olsen P status is needed to get P availability equivalent to other soil groups. In general, target Olsen P values are determined by the soil type, crop demand and rate of removal. Horticultural crops generally require high Olsen P status; pastoral demands are lower but depend on stocking rates and off-take. Forestry generally has low P demands.
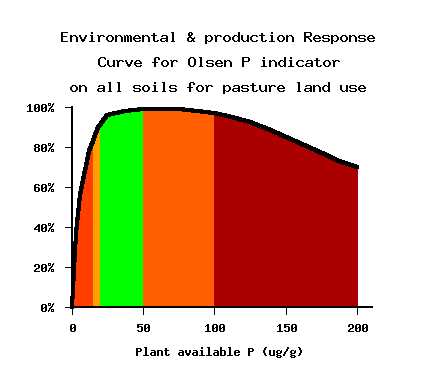
Pasture
Adequate Olsen P is essential for good grass growth and to maintain clover in the sward.
 Excessive – consistently above optimal range. P is being
applied in excess of requirement, and there is significant risk of P leaching to waterways.
Excessive – consistently above optimal range. P is being
applied in excess of requirement, and there is significant risk of P leaching to waterways.
 High – are above optimal ranges. Such levels could be found shortly after
fertiliser application, but do not need to be consistently this high because there is
little benefit to production and risk of P loss to rivers and streams is increased.
High – are above optimal ranges. Such levels could be found shortly after
fertiliser application, but do not need to be consistently this high because there is
little benefit to production and risk of P loss to rivers and streams is increased.
 Adequate – are in the recommended range for near maximum pasture production
for dairying.
Adequate – are in the recommended range for near maximum pasture production
for dairying.
 Low – are still below recommended levels, and will support only low stocking
rates.
Low – are still below recommended levels, and will support only low stocking
rates.
 Very low – will result in poor quality pasture and low dry matter production.
Indigenous native ecosystems
New Zealand indigenous species are well adapted to low P status, and higher Olsen P levels can have the disadvantage of favouring undesirable weed species in native ecosystems. Consequently, Olsen P levels of less than 8 are regarded as normal, while on Allophanic and Pumice soils of 15–20 are regarded as very high, and 20–30 as excessive. Target ranges on other soil types are even lower, with 8–12 classed as very high and 12–15 as excess. The values are based on typical levels measured in the 500 Soils Project
Pine forestry
Olsen P is rarely used to assess the P status of soils for forestry, Bray P being the preferred method. The results from the two methods are not readily convertible. Consequently, there is little information about production responses in response to Olsen P status. The defined ranges were obtained by typical Olsen P levels measured in the 500 Soil Project, which included forestry sites on a range of soil types. Pumice and Allophanic Soils are again considered as a separate category to other soil orders.
How to improve it
Low levels of Olsen P can indicate plants are not taking up sufficient P for optimum growth. In grazed pasture systems this could lead to decreased production and eventually overgrazing. The Olsen P status can be rapidly raised by adding soluble fertiliser sources such as super-phosphate or di-ammonium phosphate. The P is made soluble and able to act rapidly by industrial acidification of phosphate rock. Non-acid-treated phosphate rock is only sparingly soluble. Although much cheaper than superphosphate, it requires fine grinding to be effective and several years to take effect. Amount of fertiliser to apply was originally calculated from calibrated response curves (e.g., Roberts & Morton 1993), which used the current Olsen P status of the soil and the desired pasture production. Adequate nutrient budgeting is the best way to insure optimum production without over fertilising.
Why high is bad
Phosphate is normally strongly bound to soils, but high levels, particularly on shallow soils with low P retention risk leaching P and contaminating waters. P is often bound to surface soil particles, and surface erosion causing sediment to reach waters often carries phosphate as well. If comparatively small amounts of P reach waters this may result in contamination of water supply, algal growth and eutrophocation. Additionally, rock phosphate typically contains small amounts of impurities such as cadmium that after many repeated applications can build up in soil.
Reference material
Cornforth, I. S and Sinclaire, A. G. 1984. Fertilizer and Lime recommendations for pastures and crops in New Zealand. 2nd Edition. Wellington, New Zealand, Agricultural Research and Advisory Services Divisions, Ministry of Agriculture and Fisheries.
During, C. 1984. Fertilisers and Soils in New Zealand Farming. Third Revised Edition, Wellington, P.D. Hasselberg, Government Printer.
Edmeades DC, Metherell AK, Waller JE, Roberts, AHC, Morton, JD. 2006. Defining the relationships between pasture production and soil P and the development of a dynamic P model for New Zealand pastures: a review of recent developments. New Zealand Journal of Agricultural Research 49(2): 207-222.
HortResearch 1995. "Fertiliser Recommendations for Horticultural Crops." (The Horticulture and Food Research Institute of New Zealand Ltd, Lincoln, New Zealand) http://www.hortnet.co.nz/publications/guides/fertmanual/vege2.htm. Accessed 5 May 2011.
McDowell, R., Sharpley, A., Brookes, P., and Poulton, P. 2001. Relationship between soil test phosphorus and phosphorus release to solution. Soil Science 166, 137-149.
Roberts, A. H. C and Morton, J. D. (Eds). 1999. Fertiliser Use on New Zealand Dairy Farms. Revised Edition, 1-37. Auckland, New Zealand, New Zealand Fertiliser Manufacturers Association.
Sparling, G. P., Rijkse, W., Wilde, R. H., van der Weerden, T, Beare, M. H., and Francis, G. S. 2000 Implementing soil quality indicators for land. Research Report for 1998/1999. Landcare Research Contract Report: 9900/108. Hamilton, Landcare Research.
Sparling, G. P., Rijkse, W., Wilde, R. H., van der Weerden, T, Beare, M. H., and Francis, G. S. 2001. Implementing soil quality indicators for land. Research report for 1999/2000. Landcare Research Contract Report: 0001/059. Hamilton, Landcare Research.